When we take a medicine, two essential processes are in action: pharmacokinetics (PK) and pharmacodynamics (PD)
Pharmacokinetics asks: “What does the body do to the drug?” and Pharmacodynamics asks: “What does the drug do to the body?”
To understand how a drug works in the body, one needs to master these two fundamental concepts.
Quick Comparison of Pharmacokinetics vs Pharmacodynamics
| Feature | Pharmacokinetics (PK) | Pharmacodynamics (PD) |
| Central Question | What the body does to the drug? | What the drug does to the body? |
| Primary Focus | Drug concentration vs. Time. | Drug effect vs. Concentration. |
| Key Processes | ADME: Absorption, Distribution, Metabolism, Excretion. | Receptor binding, Signal transduction, Physiological effect. |
| Mathematical Symbols | Vd, Cl, t1/2, ke, F(Bioavailability). | Emax (Efficacy), EC50 (Potency), Kd. |
| Clinical Goal | Determining the Dose and Dosing Interval. | Determining the Effect and Safety. |
| Monitoring Method | Therapeutic Drug Monitoring (TDM) / Blood Levels. | Clinical Observation (BP, Pain scale, INR, ECG). |
| Variable Factors | Renal/Hepatic function, Age, Weight, Gastric pH. | Receptor sensitivity, Genetics, Tolerance. |
| Drug Interactions | Absorption interference, enzyme induction/inhibition, protein displacement, renal competition | Additive, synergistic, antagonistic, or physiological effects |
| Time Course | Describes drug concentration over time | Describes effect intensity over time (may lag behind concentration) |
| Key Question | Is the drug reaching the target site? | Is the drug working at the target site? |
| Clinical Example | Renal failure requires a lower dose (PK issue). | A beta-blocker slowing the heart rate (PD issue). |
While often mentioned together, these disciplines answer different but complementary questions about drug therapy.
For a healthcare provider, knowledge of both is essential for safe, effective prescribing and providing the best patient care.
This guide provides comprehensive information, including mathematical formulas, clinical applications, and high-yield facts for USMLE, NAPLEX, and NCLEX examinations.
USMLE/NAPLEX High-Yield Summary
Must-Know PK Concepts:
- Zero-order kinetics: Constant amount eliminated per unit time (ethanol, phenytoin, aspirin at high doses)
- First-order kinetics: Constant fraction eliminated per unit time (most drugs)
- Steady state: Reached after 5 half-lives (drug input equals elimination)
- Loading dose = (Vd × Target Concentration) / F
- Maintenance dose = (Clearance × Target Concentration × Dosing Interval) / F
Must-Know PD Concepts:
- Potency: Lower EC₅₀ = more potent (shift LEFT on dose-response curve)
- Efficacy: Maximum effect achievable (curve ceiling height)
- Therapeutic Index (TI) = TD₅₀ / ED₅₀ (higher is safer)
- Narrow therapeutic index drugs: Warfarin, digoxin, lithium, phenytoin, theophylline
FDA Bioequivalence Standard:
Generic drugs must demonstrate 80-125% bioavailability compared to brand-name (90% confidence interval)
Pharmacokinetics: What the Body Does to the Drug
- Pharmacokinetics describes the journey of a drug through the body, starting from administration to elimination.
- It’s summarized by four key processes, often remembered by the acronym ADME.
The Four Phases of Pharmacokinetics (ADME)
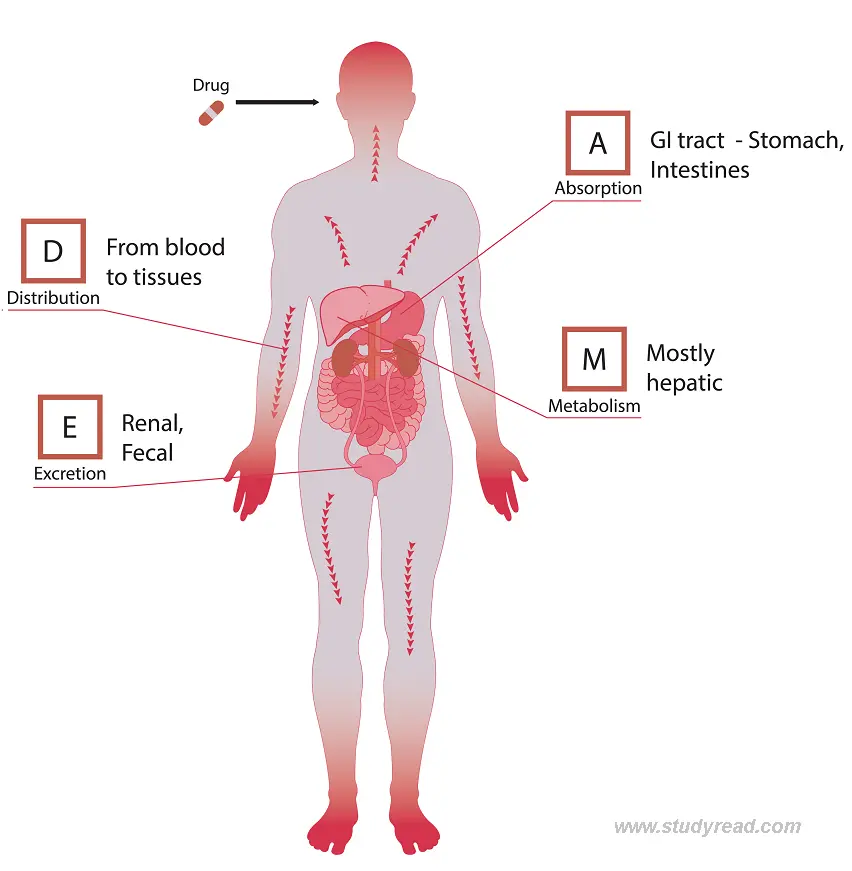
1. Absorption:
It is the process by which a drug moves from the site of administration into the bloodstream.
It helps determine the drug’s bioavailability in the body and predict its efficacy, including the required dose needed to achieve an effective concentration.
Figure 1: Typical plasma concentration-time curve. Note that Cmax remains within the therapeutic window (between MEC (Minimal Effective Concentration and MTC (Minimal Toxic Dose).
- Factors affecting absorption:
- Route of administration (oral, intravenous, IM, transdermal, etc.)
- Drug formulation (tablet form, capsule form, solution)
- Blood flow to the absorption site
- Drug solubility (lipophilic vs hydrophilic)
- First-pass metabolism (for oral drugs)
- pH at the absorption site
- IV (Intra-Venous) has the fastest absorption because the drug is injected directly into the bloodstream, whereas other routes require the drug to cross several barriers.
Clinical instance:
- Oral medications must survive stomach acid and pass through the intestinal wall.
- Drugs with extensive first-pass metabolism (like nitroglycerin) are given sublingually to bypass the liver.
2. Distribution:
This relates to how the drug is spread from the bloodstream (at the absorption site) into distant tissues and organs.
- This mostly depends on drug solubility and its ability to bind to plasma proteins.
Protein binding:
Drug molecules in the blood can bind to plasma proteins (albumin for acidic drugs, α1-acid glycoprotein for basic drugs), making them pharmacologically inactive
Only a free (unbound) drug is active and can cross membranes
- Volume of Distribution (Vd): Theoretical volume in which the drug would need to be distributed to achieve the observed plasma concentration
- Formula:
Vd = Dose / C₀Where C₀ = initial plasma concentration
- Low Vd (<5 L): Drug remains in plasma/bloodstream (e.g., heparin, warfarin)
- Medium Vd (5-15 L): Distributes to extracellular fluid (e.g., many antibiotics)
- High Vd (>15 L): Extensively distributes to tissues (e.g., digoxin, chloroquine, lipophilic drugs)
Important barriers in drug distribution:
- Blood-brain barrier (BBB): Lipophilic drugs cross easily; hydrophilic drugs require transporters
- Placental barrier: Most drugs cross; molecular weight and lipophilicity determine extent
- Blood-testis barrier
Clinical pearl: Hypoalbuminemia increases the free fraction of highly protein-bound drugs
Clinical example: Warfarin is 99% protein-bound. In patients with hypoalbuminemia (liver disease, malnutrition, nephrotic syndrome), more free warfarin is available, increasing bleeding risk even at “therapeutic” total drug levels.
3. Metabolism (Biotransformation)
The body metabolizes drugs, primarily in the liver (hepatic metabolism).
The end goal of metabolism is to make the drug inactive and water-soluble.
This happens in two steps: the Phase 1 reaction and the Phase 2 reaction
- Phase I reactions:
- Oxidation, reduction, hydrolysis (primarily via cytochrome P450 enzymes)
- Creates more polar metabolites
- May produce active, inactive, or toxic metabolites
- Major CYP450 isoforms: CYP3A4 (50% of drugs), CYP2D6, CYP2C9, CYP2C19, CYP1A2
- Phase II reactions:
- Conjugation (glucuronidation, sulfation, acetylation, methylation)
- Makes drugs more water-soluble for renal excretion
- Generally produces inactive metabolites
CYP450 Drug Interactions (High-Yield for Exams):
| CYP450 Inducers | CYP450 Inhibitors |
|---|---|
| Mnemonic: “CRAP GPS” | Mnemonic: “SICKFACES.COM” |
| Carbamazepine | Sodium valproate |
| Rifampin | Isoniazid |
| Alcohol (chronic) | Cimetidine |
| Phenytoin | Ketoconazole |
| Griseofulvin | Fluconazole |
| Phenobarbital | Acute alcohol |
| St. John’s Wort | Chloramphenicol |
| Smoking | Erythromycin |
| Sulfonamides | |
| Ciprofloxacin | |
| Omeprazole | |
| Metronidazole |
- Clinical significance:
- Enzyme Inducers increase metabolism → decreased drug levels → therapeutic failure
- Enzyme Inhibitors decrease metabolism → increased drug levels → toxicity
- Genetic polymorphisms create poor, intermediate, extensive, and ultra-rapid metabolizers
- Clinical example:
- Codeine → Morphine (via CYP2D6): CYP2D6 poor metabolizers get no analgesia from codeine
- Clopidogrel → Active metabolite (via CYP2C19): CYP2C19 poor metabolizers have reduced antiplatelet effect
- Warfarin metabolism (via CYP2C9): CYP2C9 polymorphisms affect dosing requirements
4. Excretion (Elimination)
It is the removal of drugs and their metabolites from the body.
This occurs primarily via the kidneys (renal excretion) and the liver (biliary excretion).
- Renal excretion: Main route for water-soluble drugs and metabolites
- Involves: Glomerular filtration + Active tubular secretion – Passive tubular reabsorption
- Creatinine Clearance (ClCr) estimates GFR for dose adjustment
  ClCr (males) = [(140 - age) × weight (kg)] / (72 × SCr)
  ClCr (females) = ClCr (males) × 0.85
Where SCr = serum creatinine (mg/dL)
- Dose adjustment required in renal impairment for drugs like:
- Aminoglycosides (gentamicin, tobramycin)
- Vancomycin
- Digoxin
- Lithium
- Metformin (contraindicated if GFR <30)
- Biliary excretion: For drugs eliminated in bile/feces
- Enterohepatic recirculation: Some drugs are reabsorbed from the intestine back into the circulation (prolongs half-life)
- Other routes:
- Lungs (volatile anesthetics like isoflurane)
- Sweat, saliva (minimal clinical significance)
- Breast milk (important for lactating mothers)
Elimination Kinetics: Zero-Order vs. First-Order
First-Order Kinetics (Most Drugs):
- Constant FRACTION of drug eliminated per unit time
- Exponential decay of plasma concentration
- Half-life remains constant regardless of dose
- The elimination rate depends on the drug concentration
Figure 2: Comparison of Zero-Order vs. First-Order elimination. First-order is the most common clinical model.
Equation:
C(t) = C₀ × e^(-kt)Where:
- C(t) = concentration at time t
- C₀ = initial concentration
- k = elimination rate constant
Zero-Order Kinetics (Saturable Elimination):
- Constant AMOUNT of drug eliminated per unit time
- Linear decay of plasma concentration
- Half-life increases with increasing dose
- Elimination capacity is saturated
High-Yield Zero-Order Drugs (Mnemonic: “A PEW”):
- Aspirin (at high/toxic doses)
- Phenytoin
- Ethanol
- Warfarin (at very high doses)
| Feature | First-Order Kinetics | Zero-Order Kinetics |
| Elimination Rate | Constant fraction (%) per hour | Constant amount (mg) per hour |
| Plasma Curve | Exponential (curved) | Linear (straight line) |
| Half-life (t1/2) | Constant | Variable (shorter at lower [C]) |
| Mechanism | Non-saturated enzymes | Saturated enzymes |
| Examples | Most drugs (e.g., Penicillin) | Ethanol, Phenytoin, Aspirin (toxic doses) |
Clinical significance:
Zero-order drugs are prone to toxicity because a small dose increase can lead to disproportionate increases in plasma levels.
Key Pharmacokinetic Parameters
1. Half-life (t½):
- Time for plasma drug concentration to decrease by 50%
Formula:
t½ = (0.693 × Vd) / CL- Determines dosing frequency
- After 5 half-lives: ~97% elimination (steady state achieved)
- After 1 half-life: 50% remains
- After 2 half-lives: 25% remains
- After 3 half-lives: 12.5% remains
- After 4 half-lives: 6.25% remains
2. Clearance (CL):
- Volume of plasma completely cleared of the drug per unit time
Formula:
CL = (0.693 × Vd) / t½Also:
CL = Elimination Rate / Plasma Concentration- Determines maintenance dose
- Units: mL/min or L/hr
- Total clearance = Renal clearance + Hepatic clearance + Other
3. Bioavailability (F):
- The fraction of the administered dose that reaches the systemic circulation unchanged
Formula:
F = (AUC_oral × Dose_IV) / (AUC_IV × Dose_oral)- IV drugs: F = 1.0 (100% bioavailability by definition)
- Oral drugs: F < 1.0 due to:
- Incomplete absorption
- First-pass metabolism
- Drug degradation in the GI tract
Examples:
- Nitroglycerin (oral): F ≈ 10% (extensive first-pass metabolism → given sublingually)
- Propranolol (oral): F ≈ 30%
- Levothyroxine (oral): F ≈ 80%
4. Area Under the Curve (AUC):
- Represents total drug exposure over time
- Used to assess bioequivalence between formulations
- FDA standard: Generic AUC must be 80-125% of brand-name
5. Steady State (Css):
- Achieved when drug input rate = elimination rate
Formula:
Css = (F × Dose) / (CL × τ)Where τ = dosing interval
- Reached after 5 half-lives of repeated dosing
- Critical for drugs with narrow therapeutic windows
- Loading dose can achieve immediate therapeutic levels:
Loading Dose Formula:
Loading Dose = (Vd × Target Concentration) / FMaintenance Dose Formula:
Maintenance Dose = (CL × Css × τ) / FPharmacodynamics: What the Drug Does to the Body
Pharmacodynamics describes the biochemical and physiological effects of drugs and their mechanisms of action.
Figure 2: Log Dose-Response Curve showing Potency vs. Efficacy shifts.
Figure 3: Log dose-response curve showing the characteristic sigmoid shape, Emax (efficacy), and EC50 (potency).
Mechanisms of Drug Action
1. Receptor Interactions (Most Common Mechanism)
Receptors are macromolecular proteins that mediate drug effects. Most drugs work by binding to specific receptors.
Receptor Superfamilies:
- G-protein coupled receptors (GPCRs): β-adrenergic, muscarinic, opioid receptors
- Ligand-gated ion channels: Nicotinic, GABA-A, NMDA receptors
- Enzyme-linked receptors: Insulin receptor, growth factor receptors
- Intracellular receptors: Steroid hormone receptors (nuclear receptors)
Drug-Receptor Binding:
Dissociation Constant (Kd):
Kd = [Drug] × [Receptor] / [Drug-Receptor Complex]- Lower Kd = Higher affinity (drug binds tightly to receptor)
- Kd represents the drug concentration at which 50% of receptors are occupied
- Measured in molar units (nM, μM, mM)
Types of Receptor Ligands:
A. Agonists: Activate receptors (mimic endogenous substances)
- Full agonists: Produce maximal receptor response
- Example: Morphine at μ-opioid receptors
- High intrinsic activity (α = 1)
- Partial agonists: Produce a submaximal response even at full receptor occupancy
- Example: Buprenorphine (opioid receptor)
- Intermediate intrinsic activity (0 < α < 1)
- Can act as an antagonist in the presence of a full agonist
- Inverse agonists: Produce the opposite effect to agonists
- Example: Some benzodiazepine receptor ligands
- Negative intrinsic activity (α < 0)
B. Antagonists: Block receptors without activating them
- No intrinsic activity (α = 0)
- Competitive antagonists:
- Reversible binding
- Can be overcome by increasing agonist concentration
- Parallel rightward shift of the dose-response curve (decreased potency)
- No change in Emax
- Example: Naloxone (opioid antagonist), atropine (muscarinic antagonist)
- Non-competitive antagonists:
- Irreversible or allosteric binding
- Cannot be overcome by increasing the agonist
- Downward shift of dose-response curve (decreased efficacy)
- Reduces Emax
- Example: Phenoxybenzamine (α-blocker)
2. Enzyme Interactions
- Enzyme inhibitors:
- Reversible: ACE inhibitors (captopril, lisinopril)
- Irreversible: Aspirin (COX inhibition), organophosphates (acetylcholinesterase)
- Enzyme activators: Less common
- Example: Organic nitrates activate guanylate cyclase
3. Ion Channel Modulation
- Blockers: Local anesthetics block Na⁺ channels, CCBs block Ca²⁺ channels
- Openers: Minoxidil opens K⁺ channels (vasodilation)
4. Transporter Interactions
- Inhibitors: SSRIs block serotonin reuptake, PPIs block H⁺/K⁺-ATPase
5. Other Mechanisms
- Direct chemical/physical interactions (antacids, chelating agents)
- Incorporation into biological molecules (antimetabolites)
- Immune system modulation (immunosuppressants)
Dose-Response Relationships
The relationship between drug dose (or concentration) and the magnitude of response is fundamental to pharmacodynamics.
Figure 4: Comparison of Drug A, B, and C. Drug B is less potent than A. Drug C has lower efficacy than A.
Graded Dose-Response Curve:
- X-axis: Log [Drug concentration]
- Y-axis: % Response (0-100%)
- A sigmoid (S-shaped) curve is characteristic
Key Parameters:
1. Potency (EC₅₀ or ED₅₀):
- EC₅₀: Effective Concentration producing 50% of maximal response
- ED₅₀: Effective Dose producing the desired effect in 50% of the population
- Lower EC₅₀ = More potent drug (needs less drug to achieve the same effect)
- Graphically: Leftward shift = increased potency
Important: Potency alone doesn’t determine clinical utility. A less potent drug may still be preferred if it’s safer or has fewer side effects.
2. Efficacy (Emax):
- The maximum effect a drug can produce
- Related to intrinsic activity
- Graphically: Height of the dose-response curve plateau
- More clinically important than potency
Comparison:
- Drug A: EC₅₀ = 1 nM, Emax = 100%
- Drug B: EC₅₀ = 10 nM, Emax = 100%
- Drug A is more potent (lower EC₅₀), but both have equal efficacy
Emax Model (Hill Equation):
E = (Emax × C^n) / (EC₅₀^n + C^n)Where:
- E = Effect at concentration C
- C = Drug concentration
- n = Hill coefficient (slope factor)
3. Therapeutic Indices:
Therapeutic Index (TI):
TI = TD₅₀ / ED₅₀Where:
- TD₅₀ = Toxic dose in 50% of the population
- ED₅₀ = Effective dose in 50% of the population
Therapeutic Window (or Therapeutic Range):
- Plasma concentration range between:
- MEC (Minimum Effective Concentration) and
- MTC (Minimum Toxic Concentration)
Clinical Categories:
| Drug Examples | Therapeutic Index | Clinical Implications |
|---|---|---|
| Wide TI: Penicillins, NSAIDs | TI > 10 | Safe; large margin between therapeutic and toxic doses |
| Narrow TI: Warfarin, digoxin, lithium, phenytoin, theophylline, gentamicin | TI < 2 | Requires therapeutic drug monitoring (TDM) |
4. Margin of Safety:
Margin of Safety = TD₁ / ED₉₉- More stringent measures (toxic dose affecting 1% vs effective dose for 99%)
Quantal Dose-Response Curves:
- All-or-nothing response in a population
- Used to determine ED₅₀, TD₅₀, LD₅₀ (lethal dose in 50%)
5. Slope (Hill Coefficient):
- Steeper slope = larger response increment per dose increase
- Important for drugs with narrow therapeutic windows
Advanced Receptor Theory
Affinity vs Intrinsic Activity:
| Property | Definition | Measurement |
|---|---|---|
| Affinity | How tightly drug bind to a receptor | Kd (dissociation constant) |
| Intrinsic Activity (α) | Ability of the drug-receptor complex to produce a response | 0 (antagonist) to 1 (full agonist) |
Receptor Occupancy Theory:
Response = (α × Emax × [Drug]) / (Kd + [Drug])Spare Receptors:
- Many tissues have more receptors than needed for maximal response
- Maximal response achieved with <100% receptor occupancy
- Provides “receptor reserve.”
- Example: Insulin receptors (only ~10% occupancy needed for maximal glucose uptake)
Types of Antagonism:
1. Competitive Antagonism:
- Reversible binding to the same site as the agonist
- Overcome by increasing agonist concentration
- Shifts the dose-response curve to the right (parallel shift)
- No change in Emax, only increased EC₅₀
- Example: Naloxone vs morphine, atropine vs acetylcholine
Schild Equation (quantifies competitive antagonism):
Dose Ratio - 1 = [Antagonist] / KB2. Non-competitive Antagonism:
- Irreversible binding or allosteric site binding
- Cannot be overcome by increasing the agonist
- Decreases Emax (downward shift of curve)
- May also shift the curve rightward
- Example: Phenoxybenzamine (irreversible α-blocker)
3. Chemical Antagonism:
- Direct chemical interaction between agonist and antagonist
- Example: Protamine (positively charged) neutralizes heparin (negatively charged)
4. Physiological Antagonism:
- Drugs produce opposite effects via different receptors
- Example: Histamine (bronchoconstriction) vs epinephrine (bronchodilation)
Desensitization and Tachyphylaxis:
- Tachyphylaxis: Rapid decrease in response with repeated doses (acute tolerance)
- Example: Repeated ephedrine use
- Desensitization: Receptor becomes less responsive
- Mechanisms: Receptor phosphorylation, internalization, downregulation
- Tolerance: Gradual decrease in response over days/weeks
- Example: Opioid tolerance, nitrate tolerance
Receptor Regulation:
- Upregulation: Increased receptor number (e.g., β-receptors after chronic β-blocker use)
- Downregulation: Decreased receptor number (e.g., insulin receptors in type 2 diabetes)
Comparison of Key Metrics: PK vs PD
| Parameter | Symbol | Definition | Domain | Clinical Use |
|---|---|---|---|---|
| Bioavailability | F | Fraction of dose reaching systemic circulation | PK | Route selection, dose adjustment |
| Volume of Distribution | Vd | Theoretical volume for observed plasma concentration | PK | Loading dose calculation, tissue distribution assessment |
| Clearance | CL | Volume of plasma cleared per unit time | PK | Maintenance dose calculation |
| Elimination Constant | ke | Rate of drug removal | PK | Half-life determination |
| Half-life | t½ | Time for 50% reduction in plasma concentration | PK | Dosing interval selection |
| Area Under Curve | AUC | Total drug exposure over time | PK | Bioequivalence assessment |
| Potency | EC₅₀ or ED₅₀ | Concentration/dose for 50% max effect | PD | Drug comparison, dose selection |
| Efficacy | Emax | Maximum therapeutic response achievable | PD | Drug selection for condition |
| Therapeutic Index | TI | Ratio of toxic to effective dose | PD | Safety assessment, monitoring needs |
| Dissociation Constant | Kd | Drug concentration at 50% receptor occupancy | PD | Affinity measurement |
| Intrinsic Activity | α | Ability to activate receptor | PD | Agonist vs antagonist classification |
Figure 5: Integrated PK-PD Model. Note the temporal delay (hysteresis) between peak plasma concentration and peak clinical effect.
How PK and PD Work Together
The therapeutic effect of any drug depends on both what the body does to the drug (PK) and what the drug does to the body (PD).
The PK-PD Relationship
Sequential Process:
Drug Administration → PK Processes → Plasma Concentration →
Distribution to Effect Site → PD Effects → Clinical Response
PK-PD Modeling:
Modern pharmacology uses mathematical models linking PK and PD:
Direct PK-PD Link Model:
- Plasma concentration directly correlates with the effect
- Applicable when equilibration is rapid
- Example: Neuromuscular blockers
Effect Compartment Model:
- Accounts for the delay between plasma concentration and effect
- Effect-site concentration ≠ plasma concentration
- Example: Opioids (CNS distribution delay)
Indirect Response Models:
- A drug affects the production/elimination of an endogenous mediator
- Example: Warfarin (inhibits synthesis of clotting factors)
Antibiotic PK-PD: Time vs Concentration-Dependent Killing
| Characteristic | Time-Dependent | Concentration-Dependent |
|---|---|---|
| Mechanism | Bacteriostatic, slow killing | Bactericidal, rapid killing |
| PK-PD Index | Time > MIC (T>MIC) | Cmax/MIC or AUC/MIC |
| Goal | Maintain drug level above MIC for 40-70% of dosing interval | Achieve high peak concentrations |
| Dosing Strategy | Frequent dosing or continuous infusion | High doses, less frequent |
| PAE | Minimal post-antibiotic effect | Prolonged post-antibiotic effect |
| Examples | β-lactams (penicillins, cephalosporins), carbapenems, vancomycin | Aminoglycosides, fluoroquinolones, metronidazole |
Clinical pearl: Understanding PK-PD parameters determines optimal antibiotic dosing regimens.
Clinical Integration Examples
Example 1: Warfarin Therapy (Complex PK-PD Interaction)
PK factors:
- Absorption: Well absorbed orally (F ≈ 100%)
- Distribution: 99% protein-bound (small Vd)
- Metabolism: CYP2C9 substrate (genetic polymorphisms → variable metabolism)
- CYP2C9*2 and *3 alleles → slower metabolism → lower dose requirements
- Drug interactions: Multiple CYP2C9 inhibitors/inducers affect levels
PD factors:
- Mechanism: Inhibits vitamin K epoxide reductase (VKORC1)
- Genetic variability: VKORC1 polymorphisms affect sensitivity
- Effect: Decreases synthesis of clotting factors II, VII, IX, X
- Delayed onset: 2-3 days (existing clotting factors must be depleted)
Clinical application:
- INR monitoring integrates both PK (drug level) and PD (anticoagulant effect)
- A narrow therapeutic index requires individualized dosing
- Pharmacogenomic testing (CYP2C9 and VKORC1) improves initial dosing
Example 2: Beta-Blockers (PK Determines Adverse Effect Profile)
| Drug | Lipophilicity | BBB Penetration | PK Consequence | PD Selectivity | Clinical Use |
|---|---|---|---|---|---|
| Propranolol | High | Yes | CNS side effects (nightmares, depression) | Non-selective (β₁ + β₂) | Migraine, anxiety |
| Metoprolol | Moderate | Moderate | Some CNS effects | β₁-selective | HTN, post-MI |
| Atenolol | Low | No | Minimal CNS effects | β₁-selective | HTN, angina |
| Carvedilol | High | Yes | CNS effects possible | Non-selective + α₁ | Heart failure |
Clinical pearl: PK (lipophilicity) affects side effect profile; PD (selectivity) affects therapeutic applications.
Example 3: Morphine (PK-PD Disconnect Due to Active Metabolite)
PK pathway:
- Morphine → Glucuronidation (UGT2B7) → Metabolites
- Morphine-6-glucuronide (M6G): More potent than morphine
- Morphine-3-glucuronide (M3G): Inactive, may cause neurotoxicity
PD effects:
- M6G accumulates in renal impairment (renally excreted)
- Plasma morphine levels may not correlate with analgesic effect
- Clinical consequence: Dose reduction needed in CKD to prevent M6G accumulation and toxicity
Example 4: Antibiotics (PK-PD Indices Guide Dosing)
Time-Dependent: Ceftriaxone (β-lactam)
- PK-PD target: Time above MIC (T>MIC) for 60-70% of dosing interval
- Dosing: Once daily, possible due to long half-life (5-9 hours)
- Strategy: Maintain adequate plasma levels continuously
Concentration-Dependent: Gentamicin (aminoglycoside)
- PK-PD target: Peak concentration/MIC ratio >8-10
- Dosing: Once-daily high-dose regimen
- Strategy: Maximize Cmax, utilize prolonged post-antibiotic effect (PAE)
- Monitoring: Peak and trough levels to ensure efficacy and avoid toxicity
Why Both Matter in Clinical Practice
For Dosing Regimens:
- PK determines:
- How often to dose (based on half-life and steady-state kinetics)
- Which route to use (based on bioavailability)
- Whether a loading dose is needed (based on Vd and desired speed of onset)
- PD determines:
- How much to dose (based on dose-response relationship)
- Target plasma level (based on EC₅₀ and therapeutic window)
- Dosing strategy (continuous vs intermittent based on PK-PD relationship)
For Drug Interactions:
PK Interactions (Alter Drug Levels):
- Absorption: Chelation (tetracycline + calcium), pH changes (ketoconazole + PPIs)
- Distribution: Protein binding displacement (warfarin + NSAIDs)
- Metabolism: CYP450 induction (rifampin + oral contraceptives) or inhibition (ketoconazole + statins)
- Excretion: Competition for renal tubular secretion (probenecid + penicillin)
PD Interactions (Alter Drug Effects Without Changing Levels):
- Additive: Two drugs with the same mechanism (NSAID + aspirin)
- Synergistic: Effect greater than the sum (sulfamethoxazole + trimethoprim)
- Antagonistic: Opposing effects (β-blocker + β-agonist)
- Physiological antagonism: Different mechanisms, opposite effects (insulin + glucagon)
Clinical pearl: Always consider BOTH types when evaluating drug interactions.
For Special Populations:
Pediatrics:
- PK changes:
- Immature hepatic metabolism (first 6 months)
- Increased Vd (higher body water content)
- Developing renal function (reaches adult levels by 1 year)
- PD changes:
- Increased receptor sensitivity to some drugs
- The blood-brain barrier is more permeable
- Dosing: Usually weight-based (mg/kg), not adult dose reduction
Geriatrics:
- PK changes:
- ↓ Hepatic blood flow and metabolism
- ↓ Renal function (GFR decreases ~1 mL/min/year after age 40)
- ↓ Total body water, ↓ lean mass, ↑ body fat
- ↓ Albumin (in malnourished)
- Altered gastric pH and motility
- PD changes:
- Increased sensitivity to CNS drugs (benzodiazepines, opioids)
- Decreased sensitivity to β-agonists/antagonists
- Altered homeostatic mechanisms
- Clinical pearl: “Start low, go slow” – begin with lower doses, titrate carefully
Pregnancy:
- PK changes:
- ↑ Plasma volume (40-50% increase) → ↑ Vd for hydrophilic drugs
- ↑ GFR (50% increase) → ↑ renal clearance
- ↑ Hepatic metabolism (some CYP450 isoforms)
- ↓ Albumin concentration → ↑ free fraction of protein-bound drugs
- ↓ GI motility
- PD changes:
- Placental transfer affects fetal exposure
- Teratogenic risk varies by trimester
- Dosing adjustments: May need increased doses of some medications (e.g., levothyroxine, lamotrigine)
Renal Impairment:
- PK: ↓ Clearance of renally eliminated drugs and active metabolites
- Calculation: Use Cockcroft-Gault or CKD-EPI to estimate GFR
- Dose adjustment: Reduce dose or extend dosing interval based on CrCl
- High-risk drugs: Digoxin, aminoglycosides, vancomycin, lithium, metformin, DOACs
Hepatic Impairment:
- PK:
- ↓ Metabolism of hepatically cleared drugs
- ↓ Protein synthesis → ↓ albumin → ↑ free drug fraction
- Portal hypertension → shunting → ↓ first-pass metabolism
- Severity assessment: Child-Pugh score
- Avoid: Hepatotoxic drugs, drugs with extensive hepatic metabolism in severe cirrhosis
Pharmacokinetics vs Pharmacodynamics examples
| Drug | The PK Action (ADME) | The PD Action (Mechanism/Effect) |
| Phenytoin | Exhibits Zero-order kinetics at high doses; the liver becomes saturated and levels skyrocket. | Blocks Voltage-Gated Sodium Channels to prevent seizure discharge. |
| Digoxin | Has a very large Volume of Distribution ($V_d$) because it binds heavily to heart and skeletal muscle. | Inhibits Na+/K+-ATPase pump, increasing intracellular calcium and heart contractility. |
| Aspirin | It is a weak acid; its absorption is highly dependent on Gastric pH levels. | Irreversibly inhibits COX-1 and COX-2 enzymes, reducing prostaglandin synthesis. |
| Morphine | Undergoes extensive Glucuronidation in the liver to form active and inactive metabolites. | Acts as a Mu-Opioid Receptor Agonist in the CNS to alter the perception of pain. |
Common Student Misconceptions
Misconception 1: “Half-life determines drug duration of action”
- Reality: Duration of action depends on:
- PK: How long is the therapeutically effective concentration maintained
- PD: How long receptors remain occupied or affected (receptor dissociation rate)
- Example: Alendronate has t½ = 10 years (bone binding), but clinical effects last weeks after stopping
- Example: Finasteride effects persist months after discontinuation despite a shorter half-life
Misconception 2: “Higher doses always produce greater effects.”
- Reality:
- Once Emax is reached, increasing the dose only increases side effects
- Dose-response curve plateaus at maximum efficacy
- Example: Increasing the SSRI beyond the recommended dose doesn’t improve depression but increases adverse effects
Misconception 3: “All drug interactions are pharmacokinetic.
“
- Reality:
- PK interactions change drug concentrations (e.g., CYP450 inhibition)
- PD interactions occur at receptor/effect level with unchanged concentrations
- Example: Combining two CNS depressants (benzodiazepine + alcohol) = PD interaction
- Example: Warfarin + amiodarone = both PK (CYP2C9 inhibition) AND PD (amiodarone has intrinsic anticoagulant effect)
Misconception 4: “Generic drugs are less effective than brand names.”
- Reality:
- FDA requires generics to be bioequivalent: AUC and Cmax within 80-125% of brand
- Same active ingredient, dose, route, dosage form
- May differ in inactive ingredients (binders, fillers)
- Rare exceptions: Narrow therapeutic index drugs where small differences matter (levothyroxine, warfarin, antiepileptics) – some recommend brand consistency
Misconception 5: “Plasma drug level directly equals effect”
- Reality:
- Hysteresis = delay between plasma concentration and effect
- Reasons: Distribution to the effect site, indirect mechanisms, and active metabolites
- Example: Warfarin plasma levels peak in hours, but the anticoagulant effect peaks in 2-3 days
Misconception 6: “Loading doses are just high maintenance doses.”
- Reality:
- Loading dose = (Vd × Target Css) / F
- Maintenance dose = (CL × Css × τ) / F
- Different formulas because they serve different purposes
- Loading dose rapidly achieves the therapeutic level; maintenance replaces the eliminated drug
Misconception 7: “First-pass metabolism only applies to oral drugs.”
- Reality:
- Applies to any route where a drug passes through the liver before reaching systemic circulation
- Affected routes: Oral, rectal (partial)
- Not affected: IV, IM, subcutaneous, sublingual, transdermal, inhalation
- Rectal: Lower rectum drains to IVC (bypasses liver); upper rectum drains to portal vein
Study Tips for Healthcare Students
High-Yield Exam Strategies
For USMLE Step 1:
- Focus on mechanisms over memorization
- Master zero-order kinetics drugs (A PEW mnemonic)
- Know CYP450 inducers and inhibitors (CRAP GPS / SICKFACES.COM)
- Understand competitive vs non-competitive antagonism graphically
- Practice dose-response curve interpretation
For NAPLEX:
- Therapeutic drug monitoring (TDM) indications and target ranges
- Renal dosing adjustments using Cockcroft-Gault
- Drug interaction mechanisms (both PK and PD)
- Loading dose and maintenance dose calculations
- Narrow therapeutic index drugs and monitoring
For NCLEX:
- Peak and trough timing for antibiotics
- Signs of drug toxicity for common medications
- Patient education on timing, food interactions
- Safe administration routes and techniques
Essential Calculations to Master
1. Loading Dose:
LD = (Vd × Css) / F

Example: Digoxin loading dose
- Vd = 500 L
- Target Css = 1.5 ng/mL
- F = 0.7 (oral)
LD = (500 L × 1.5 ng/mL) / 0.7 = 1071 ng ≈ 1 mg
2. Maintenance Dose:
MD = (CL × Css × τ) / F

Example: Theophylline maintenance
- CL = 3 L/hr
- Target Css = 10 mg/L
- τ = 12 hr
- F = 1.0 (IV)
MD = (3 L/hr × 10 mg/L × 12 hr) / 1.0 = 360 mg q12h
3. Creatinine Clearance (Cockcroft-Gault):
CrCl (male) = [(140 - age) × weight (kg)] / (72 × SCr)
CrCl (female) = CrCl (male) × 0.85

Example: 70-year-old male, 80 kg, SCr = 1.5 mg/dL
CrCl = [(140-70) × 80] / (72 × 1.5) = 5600 / 108 = 52 mL/min
4. Adjusted Body Weight (for obese patients):
ABW = IBW + 0.4(TBW - IBW)

Used for: Aminoglycosides, vancomycin dosing
Study Techniques That Work
1. Create Comparison Charts:
Make tables comparing drugs in the same class:
| β-Blocker | Selectivity | Lipophilicity | t½ | ISA | Indications |
|---|---|---|---|---|---|
| Propranolol | Non-selective | High | 3-6 hr | No | Migraine, tremor, anxiety |
| Metoprolol | β₁-selective | Moderate | 3-7 hr | No | HTN, angina, post-MI |
| Atenolol | β₁-selective | Low | 6-7 hr | No | HTN, angina |
| Carvedilol | Non-selective + α₁ | High | 6-10 hr | No | Heart failure |
2. Use Clinical Scenarios:
Don’t just memorize facts – apply them:
- “A patient on warfarin starts rifampin. What happens?” (CYP450 induction → ↓ warfarin levels → ↓ INR → clotting risk)
- “Elderly patient prescribed morphine develops confusion. Why?” (Active metabolite M6G accumulates in renal impairment)
3. Draw the Curves:
Practice sketching:
- Dose-response curves (competitive vs non-competitive antagonism)
- Plasma concentration-time curves (zero vs first-order kinetics)
- Log dose-response curves (comparing potency and efficacy)
4. Master the Formulas:
Create a formula sheet and work through practice problems daily:
- Half-life, clearance, Vd relationships
- Loading and maintenance dose calculations
- Creatinine clearance and dose adjustments
5. Make Mnemonics That Stick:
- Zero-order drugs: “A PEW” (Aspirin, Phenytoin, Ethanol, Warfarin)
- CYP450 inducers: “CRAP GPS” (Carbamazepine, Rifampin, Alcohol chronic, Phenytoin, Griseofulvin, Phenobarbital, Smoking)
- CYP450 inhibitors: “SICKFACES.COM”
- Narrow TI drugs: “WE GLADLY Take Drugs” (Warfarin, Epilepsy drugs, Gentamicin, Lithium, Aminoglycosides, Digoxin, Levothyroxine, Theophylline, Drugs for transplant)
For Clinical Practice
1. Think Systematically:
When a drug isn’t working or causes unexpected effects:
- PK check: Is it reaching the target site?
- Absorption issues? (food, pH, malabsorption)
- Distribution issues? (protein binding, barriers)
- Metabolism issues? (drug interactions, genetic polymorphisms, organ dysfunction)
- Excretion issues? (renal/hepatic impairment)
- PD check: Is it producing the expected effect?
- Correct diagnosis/indication?
- Adequate dose for this patient?
- Drug interactions at the receptor level?
- Tolerance/desensitization developed?
2. Consider Individual Variation:
No two patients are identical. Always assess:
- Genetic factors: CYP450 polymorphisms, receptor variants
- Age: Pediatric vs geriatric considerations
- Organ function: Renal and hepatic status
- Disease states: Altered protein binding, distribution changes
- Concurrent medications: Both PK and PD interactions
- Adherence: Is the patient actually taking the medication?
3. Monitor Appropriately:
Different drugs require different monitoring:
- PK monitoring (drug levels):
- Narrow TI drugs: digoxin, phenytoin, theophylline, aminoglycosides, vancomycin
- Goal: Maintain therapeutic range, avoid toxicity
- PD monitoring (clinical effects):
- Warfarin → INR (functional measure of anticoagulation)
- Antihypertensives → blood pressure
- Analgesics → pain scores
- Antidepressants → mood scales
- Combined PK-PD monitoring:
- Some drugs need both (e.g., vancomycin: trough levels + clinical response)
4. Anticipate Drug Interactions:
Before adding any new medication:
- Check for PK interactions (CYP450, absorption, excretion)
- Check for PD interactions (additive effects, antagonism)
- Adjust doses preemptively when indicated
- Monitor more closely during transition periods
Key Takeaways
Pharmacokinetics:
- Describes drug movement through the body (ADME)
- Answers “What does the body do to the drug?”
- Determines drug concentration at the target site
- Influenced by: route, formulation, metabolism, excretion
Pharmacodynamics:
- Describes drug effects on the body
- Answers “What does the drug do to the body?”
- Determines the magnitude and duration of the response
- Influenced by: receptor binding, dose-response relationship, drug interactions
Clinical Integration:
- Both are essential for rational drug therapy
- PK gets the drug to the target; PD produces the effect
- Understanding both prevents medication errors and optimizes patient outcomes
- Individual patient factors affect both PK and PD
High-Yield Clinical Pearls
PK Pearls:
- Steady state = 5 half-lives (applies to both reaching steady state and complete elimination)
- The first-pass effect is why oral bioavailability is < 100% for many drugs
- Protein binding displacement only matters for highly bound drugs (>90%) with narrow TI
- Renal impairment affects more than just renally excreted drugs – active metabolites accumulate too (morphine-6-glucuronide)
- Grapefruit juice inhibits CYP3A4 in the gut wall → ↑ bioavailability of affected drugs
PD Pearls:
- Potency is not efficacy – a less potent drug may be more effective clinically
- Partial agonists can act as antagonists in the presence of full agonists
- Spare receptors mean maximal response possible with <100% receptor occupancy
- Tolerance develops faster to some effects than others (e.g., analgesic tolerance to opioids vs respiratory depression)
- Receptor upregulation after chronic antagonism explains rebound phenomena (β-blockers, PPIs)
PK-PD Integration Pearls:
- Effect-site equilibration delay explains why some drugs work faster than their t½ suggests
- Active metabolites mean plasma drug levels don’t always correlate with effect
- Prodrugs have no PD activity until metabolized to the active form (clopidogrel, codeine, enalapril)
- Time above MIC matters more than peak for β-lactam antibiotics
- FDA bioequivalence (80-125% rule) ensures generics work, but small differences can matter for narrow TI drugs
Conclusion
Pharmacokinetics and pharmacodynamics are two sides of the same coin in understanding drug therapy.
While pharmacokinetics tracks the drug’s journey through the body, pharmacodynamics explains the drug’s effects once it reaches its target.
Neither is sufficient alone – optimal drug therapy requires integration of both disciplines.
Why Mastery of PK-PD Matters
As future healthcare professionals, integrating PK and PD knowledge enables you to:
Clinical Decision-Making:
- Choose appropriate drugs and doses for individual patients
- Predict and prevent drug interactions before they occur
- Adjust therapy intelligently in special populations (renal/hepatic impairment, pregnancy, extremes of age)
- Troubleshoot when medications don’t work as expected
Patient Safety:
- Recognize early signs of drug toxicity
- Understand why therapeutic drug monitoring is necessary
- Anticipate adverse effects based on the mechanism
- Make evidence-based decisions about generic substitution
Effective Communication:
- Explain medication timing and administration to patients
- Discuss drug interactions with colleagues and pharmacists
- Justify dosing decisions using pharmacological principles
- Educate patients about the expected onset and duration of effects
The integration of PK and PD knowledge transforms drug facts into clinical wisdom, making you a safer, more effective practitioner.
Beyond the Basics
Advanced topics for continued learning:
- Population pharmacokinetics: Using population data to predict individual responses
- Pharmacogenomics: How genetic variations affect both PK (CYP450, transporters) and PD (receptor polymorphisms)
- Chronopharmacology: How circadian rhythms affect drug response
- Precision medicine: Tailoring therapy based on individual PK-PD characteristics
Further Reading and Resources
Textbooks
- Goodman & Gilman’s The Pharmacological Basis of Therapeutics (13th Edition) – Comprehensive reference
- Basic & Clinical Pharmacology by Katzung (15th Edition) – Excellent for students
- Applied Pharmacokinetics & Pharmacodynamics by Vinks et al. (4th Edition) – Advanced PK-PD concepts
- Clinical Pharmacokinetics and Pharmacodynamics by Rowland and Tozer – Mathematical approaches
Online Resources
- FDA Drug Databases:
- Clinical Guidelines:
- Academic Resources:
Professional Organizations
- American Society for Clinical Pharmacology and Therapeutics (ASCPT)
- American College of Clinical Pharmacy (ACCP)
- International Society for Pharmacoepidemiology (ISPE)
Exam Preparation
- USMLE First Aid – High-yield pharmacology
- NAPLEX Review Books – Practice calculations and case studies
- Pharmacology Flash Cards – Quick review of mechanisms
- Online Question Banks (UWorld, Kaplan, Board Vitals)
This article is designed for educational purposes for medical, nursing, and pharmacy students preparing for professional examinations and clinical practice. While comprehensive, it should be supplemented with current clinical guidelines, drug references, and evidence-based resources for actual patient care decisions. Always consult primary literature and approved drug labeling for the most current prescribing information.
For clinical questions or concerns about specific patients, consult with supervising physicians, clinical pharmacists, or other appropriate healthcare professionals.
